
On-time performance remains one of the most visible measures in K-12 transportation. It is easy to explain, easy to trend, and closely connected to the daily experience of students, families, schools, and drivers.

Adding ride time, route efficiency, seat utilization, safety and fleet indicators, and cost per rider to on-time performance gives K-12 transportation teams a fuller view of performance. A district-wide on-time percentage shows that performance changed, and these related measures show where, why, and what to do next. A useful transportation data program moves from a headline metric to a connected view of reliability, ride time, route efficiency, capacity, safety, and cost.
A broader set of measures gives teams a consistent way to identify patterns, test changes, and explain results.
Build on a consistent definition of on time
Many of the metrics that extend beyond on-time performance build on it. Segmented reliability, ride time, and route duration all draw on the same planned and actual times, and each helps a district answer a different question. A consistent on-time definition gives every related measure a reliable foundation. Districts should document the on-time window, the scheduled event being measured, and the data source behind the calculation.
For example, a district might measure whether a bus arrived at a school within a defined window of the planned arrival time. Another might measure student pickup performance at stops. Both can be useful, but they answer different questions.
A clear definition should identify:
- The scheduled event: first stop, school arrival, last drop-off, or another milestone
- The allowed early or late window
- Whether the measure applies to completed trips, scheduled trips, or all planned service
- How cancellations, missed stops, substitutions, and route changes are handled
- Which system provides the planned time, and which system provides the actual time
The Council of the Great City Schools’ KPI research emphasizes the value of consistent operational measures that allow districts to benchmark performance and track improvement over time. The same principle applies at the district, school, route, and trip levels.
Break the average into useful segments
A district-wide average can hide meaningful differences. Once a performance measure is defined, segment it in ways that help a transportation team find the next action.
Useful views include:
- School and grade band (elementary, middle, and high school)
- Route and run
- First stop, school arrival, and last drop-off
- Morning versus afternoon service
- Day of week and time period
- Depot, contractor, vehicle, or driver assignment
- General education and specialized transportation
- Planned versus actual route duration
A route that is late at the first stop may point to an unrealistic start time, a vehicle availability issue, or a recurring traffic pattern. A route that begins on time but arrives late at school may indicate stop density, loading time, bell-time coordination, or route structure. The district average cannot distinguish between those scenarios, but a segmented view can.
The most useful comparison often asks, “Which routes show the same pattern repeatedly, and what do they have in common?”
Pathwise’s post How to Use First-Quarter Data to Adjust K-12 Transportation Plans recommends reviewing on-time performance alongside school, route, and time-period detail, as well as cost and coverage measures. That combination helps teams evaluate whether a change improved the whole operation instead of optimizing one number in isolation.
Pair reliability with ride time
On-time performance tells a district whether service aligns with the plan. Ride time helps show what the experience looks like for students once they are on the bus.
Track average and maximum ride time by school, route, program, and time period. Review the distribution, not just the average. A route with a reasonable average may still include a smaller group of students with consistently long rides.
Ride-time data can help answer questions such as:
- Are longer rides concentrated in a specific attendance area?
- Did a route change improve on-time performance while increasing student ride time?
- Are specialized transportation requirements creating recurring schedule pressure?
- Are bell schedules causing routes to compete for the same vehicles?
- Are long rides isolated events or a persistent pattern?
Ride time should not be treated as an automatic failure signal. Geography, school choice, specialized services, and other district requirements shape what is practical. The value of the metric is that it gives leaders a consistent way to identify where a closer review is warranted.
Measure route efficiency and capacity
Reliability and efficiency are related measures that answer different questions. A route can run on time and still use more miles, vehicles, or driver hours than necessary. That is why transportation teams should pair service metrics with measures of route and fleet utilization.
Consider tracking:
- Route duration compared with the plan
- Total miles and deadhead miles
- Students transported per route
- Daily seat utilization
- Routes or runs assigned per vehicle
- Vehicle and driver utilization
- Cost per route, mile, or rider
- Number of route changes after the school year begins
The Council of the Great City Schools’ Managing for Results report benchmarks transportation efficiency measures such as cost per mile, cost per rider, daily runs per bus, and daily seat utilization across large urban districts. The right set will vary by district, but the principle is consistent: connect the metric to a decision.
For example, low utilization may prompt a review of ridership assumptions, stop placement, bell schedules, or vehicle assignment. High route duration may call for a closer look at stop density, traffic, loading procedures, or the time allowed between runs. Cost per rider may help leaders compare service models or explain why a fleet or staffing investment is needed.
Add safety, fleet, and service indicators
Transportation data should also help teams identify risks before they become service disruptions. Safety and fleet measures can provide early signals that do not appear in an on-time percentage.
Depending on the district’s systems and priorities, a broader scorecard may include:
- Preventable accidents and safety incidents
- Road calls and service interruptions
- Preventive maintenance completion
- Vehicle availability at pull-out
- Speeding, harsh braking, or other driving-behavior trends
- Stop-arm or crossing-related events
- Missed, skipped, or duplicated stops
- Calls and messages from families, grouped by common topic
- Time required to place new students on routes
The NYC Public Schools transportation vendor report card is one public example of a multi-dimensional performance view. It includes measures related to route subscription, staffing capacity, fleet readiness, safety, compliance, and GPS-based driving behavior rather than relying on a single service statistic.
Not every district needs every measure. A practical approach is to choose a small set of indicators that represents the district’s operating priorities and can be reviewed consistently.
Make the data trustworthy before making it visible
Dashboards are most reliable when the source data behind them is consistent. Before using transportation data to make planning or budget decisions, confirm that the underlying records line up.
At a minimum, review whether the data connects:
- Student and rider records to current eligibility and school assignment
- Route plans to the actual vehicle and run operated
- Scheduled times to current bell schedules and stop sequences
- GPS events to the correct route and service day
- Route changes to the date and reason for the change
- Exceptions to a shared definition across dispatch, schools, and leadership
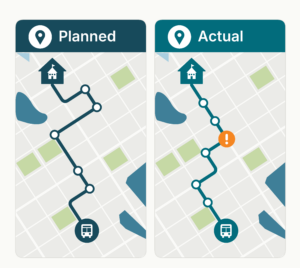 This matters because an on-time percentage can appear precise even when the system is comparing a GPS trace to the wrong route plan or an outdated schedule. Verification is a core part of measurement and belongs at the start of any dashboard project.
Pathwise’s Key Performance Indicators in District Operations explains how transportation analytics can help districts identify problem areas, support resource decisions, and connect operational performance to broader district goals.
Turn the scorecard into an action loop
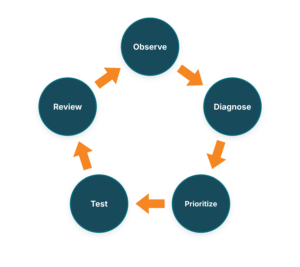
Data becomes useful when it creates a repeatable conversation. A practical review cycle can follow five steps:
- Observe: Identify a recurring pattern by school, route, program, or time
 period.
- Diagnose: Compare related measures and investigate likely causes with dispatchers, drivers, schools, and other stakeholders.
- Prioritize: Select an issue where a targeted change is feasible and the expected benefit is clear.
- Test: Adjust a route, schedule, stop, assignment, communication process, or maintenance practice.
- Review: Compare results against the original baseline and document what changed.
 period.
Actions can be small and targeted: a revised school arrival target, a different vehicle assignment, a stop-sequence adjustment, or a focused review of one attendance area.
The important part is preserving the connection between the finding and the response. If a route is consistently late after the third stop, the review should document what was changed and whether later trips, ride times, or vehicle utilization were affected.
A practical transportation data scorecard
Question | Helpful measures | Possible next action |
Are buses arriving when planned? | On-time performance by school, route, stop, and time period | Review recurring late patterns and validate schedules |
Are students spending a reasonable amount of time on the bus? | Average and maximum ride time by program and route | Review route structure, bell schedules, and specialized service needs |
Are routes using available capacity effectively? | Ridership, seat utilization, route duration, and deadhead miles | Revisit stop placement, vehicle assignments, and run sequencing |
Are vehicles and drivers supporting reliable coverage? | Vehicle availability, road calls, substitutions, and driver coverage | Coordinate maintenance, staffing, and daily dispatch planning |
Are services safe and consistent? | Incidents, maintenance compliance, driving behavior, and missed stops | Identify recurring risk patterns and assign follow-up owners |
Can leaders explain the cost of service? | Cost per rider, route, mile, or vehicle | Connect budget decisions to service and utilization data |
Review cadence matters
Different decisions require different time horizons.
- Daily: Review exceptions, missed stops, vehicle substitutions, and immediate service disruptions.
- Weekly: Look for recurring delays, route duration changes, ride-time outliers, and coverage issues.
- Monthly: Compare school, route, depot, program, and fleet trends; assign owners to priority actions.
- Quarterly or seasonally: Revisit route assumptions, bell schedules, staffing, ridership, cost, and fleet needs.
- Annually: Use the full history to inform routing strategy, budget requests, contract conversations, and capital planning.
A clear cadence helps teams separate one-time events from lasting trends and address patterns while there is still time to act.
Move from reporting to operational learning
The most valuable transportation dashboard helps a team answer three questions quickly:
- What is happening?
- Why is it happening?
- What should change next?
The on-time percentage remains an important part of that conversation. It becomes more useful when it is defined consistently, broken into actionable segments, and reviewed alongside ride time, route efficiency, capacity, safety, fleet, and cost measures.
When those measures are connected to verified route and GPS data, transportation leaders can move from reporting what happened to learning what to do next. A connected data program helps districts improve performance as well as describe it.
The annual review is a natural place to start. Looking across a full year of routing and transportation data brings the measures in this post together, showing how reliability, ride time, route efficiency, and cost trends connect and where they point next. Pathwise will walk through that process in the upcoming webinar, Your Year in Review: What Routing and Transportation Data Can Reveal, on Wednesday, November 18, at 12 p.m. ET. Register for the webinar to see how a year of data can shape plans for the year ahead.